Data Analytics With GPT-3 and Streamlit
It’s truly amazing what developers can build these days by hacking together a few APIs. Almost seems like the original promise of Web 2.0 mashups (remember those? 👴) has finally been fulfilled. Just a few years ago, it would have taken weeks or months to develop certain kinds of data analytics apps. Today, they can be built in less than an hour.
In this post I will show how to build a simple web app that extracts analytics data with GPT-3 from unstructured text and renders tables, charts, and maps based on that data. To build it, we will use Streamlit, a Python framework that allows developers to quickly create analytics and ML apps without having to write extensive frontend code. To process unstructured text, we’ll use GalaxyBrain, my experimental framework for LLM workflows that provides primitives for OpenAI completions, prompts, memory, rules, and more.
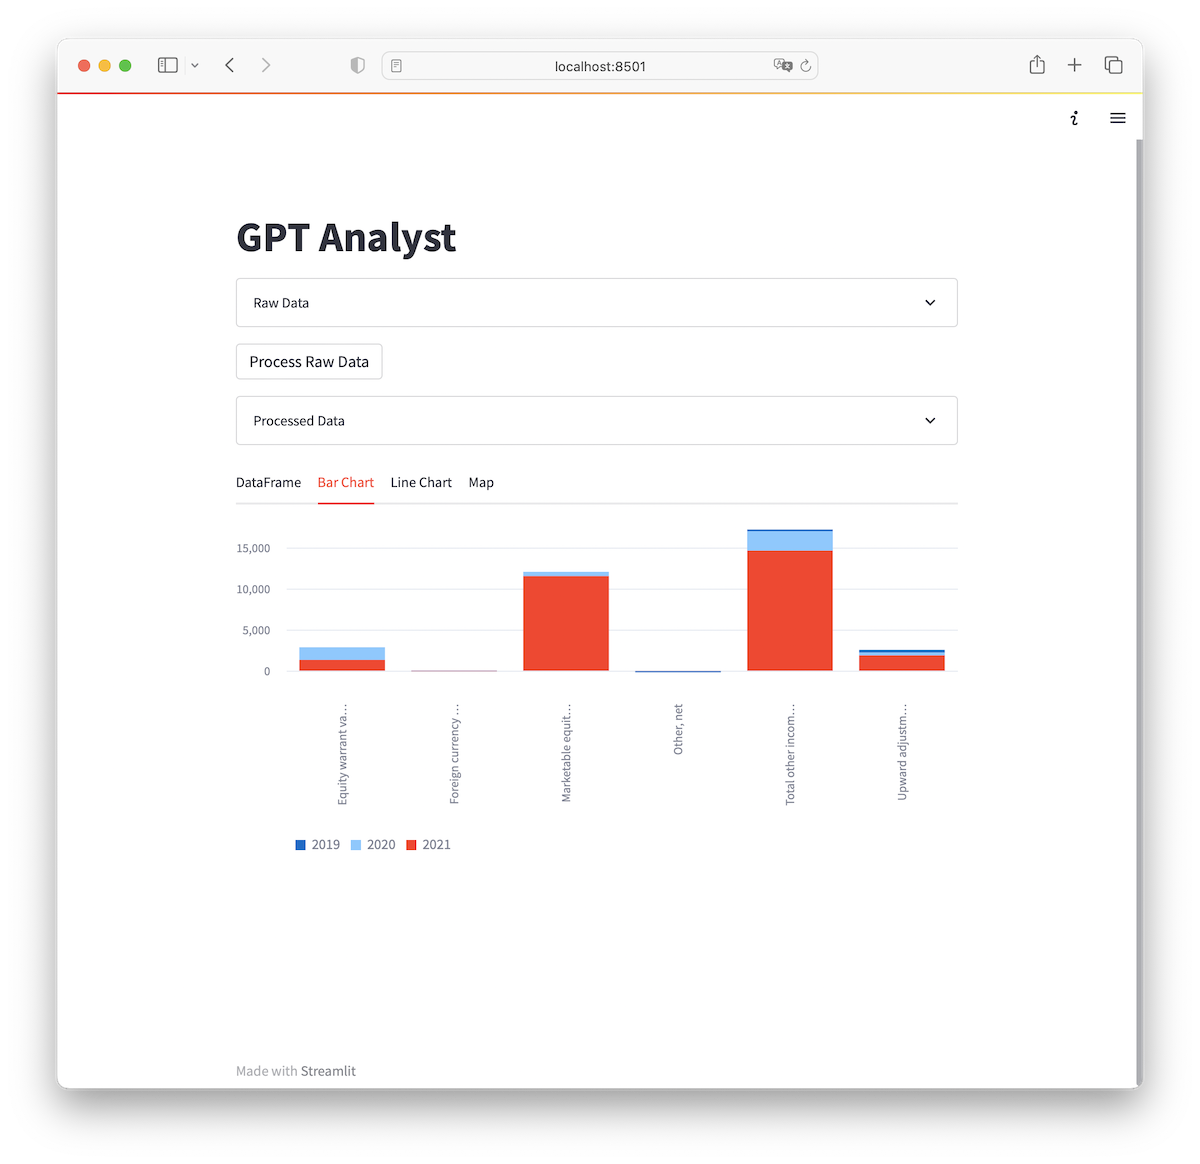 This is what we are aiming for by the end of this post.
Before we start, I have to admit that, to my shame, I’ve mostly ignored recent developments in AI and LLMs (large language models) until I saw ChatGPT just over a month ago (not a particularly uncommon story). After playing with it, I felt a wave of excitement that was reminiscent of growing up in the 90s when I learned about the Internet and used Netscape Navigator for the first time. Since discovering ChatGPT, I’ve been tinkering with LLMs to learn how they work and to see how they can be used to build real-world applications. I’m going to be sharing more findings about all things LLM, so if you are interested please subscribe and follow.
Let’s start by writing the app in Streamlit. At the high level, we want it to do the following:
- Take unstructured input from the user.
- Query the GPT-3 model with a request to process the input and return it as a JSON object.
- Parse the input into a DataFrame.
- Use the DataFrame to render visualizations like tables, charts, and maps.
Time to write some code!
# We want OpenAI to extract analytics data and return it as a valid JSON object,
# so let's defined some rules
rules = [
    json_rules.return_valid_json(),
    Rule("act as an analyst and extract quantitative data from your inputs")
]

# Now, let's define a default workflow driver that will be automatically used
# to make requests to GPT.
driver = OpenAiCompletionDriver(temperature=0.5, user="demo")

# Finally, setup the workflow
workflow = Workflow(rules=rules, completion_driver=driver)

if "is_data_processed" not in st.session_state:
    st.session_state.is_data_processed = False

st.title("GPT Analyst")

# Ask for user input
with st.expander("Raw Data", expanded=True):
    raw_text = st.text_area(
        "Add analytics text",
        height=400
    )

# Once the "Process" button is clicked, we kick off the magic.
if st.button("Process Raw Data") or st.session_state.is_data_processed:
    with st.spinner("Please wait..."):
        try:
            # Add a completion step to the workflow
            step = workflow.add_step(
                CompletionStep(input=Prompt(raw_text))
            )

            # Start the workflow. This will execute out only Step defined above
            workflow.start()

            # Only proceed if the LLM result was validated against our rules
            validator = Validator(step.output, rules)

            if validator.validate():
                st.session_state.is_data_processed = True

                processed_text = step.output.value

                # Add a text field for the OpenAI output that the user can tweak.
                # When this field is updated all charts and tables are automatically
                # refreshed.
                with st.expander("Processed Data", expanded=True):
                    edited_data = st.text_area(
                        "Edit processed data",
                        processed_text,
                        height=400
                    )

                # Finally, render default Streamlit visualizations
                tab1, tab2, tab3, tab4 = st.tabs(
                    ["DataFrame", "Bar Chart", "Line Chart", "Map"]
                )

                with tab1:
                    try:
                        st.dataframe(to_dataframe(edited_data), use_container_width=True)
                    except Exception as err:
                        st.error(err)
                with tab2:
                    try:
                        st.bar_chart(to_dataframe(edited_data))
                    except Exception as err:
                        st.error(err)
                with tab3:
                    try:
                        st.line_chart(to_dataframe(edited_data))
                    except Exception as err:
                        st.error(err)
                        pass
                with tab4:
                    try:
                        st.map(to_dataframe(edited_data))
                        pass
                    except Exception as err:
                        st.error(err)
            else:
                failed_rules = "\n".join([rule.value for rule in validator.failed_rules()])

                st.error(f"The following rules failed: {failed_rules}")

        except Exception as err:
            st.error(err)
            logging.error(err.with_traceback, exc_info=True)
After the user presses the submit button, we add a CompletionStep to Workflow and start it. Then we validate the output and load it into a new text field that the user can tweak. Finally, we use Streamlit to render an interactive table, some charts, and a map. All of those primitives use Pandas DataFrames—a common data structure for data analytics and ML tasks.
Depending on the requirements, we can always play more with different rules. For example, we can add a rule to change our JSON output keys:
rules = [
    json_rules.return_valid_json(),
    Rule("act as an analyst and extract quantitative data from your inputs"),
    Rule("all JSON keys should be in PascalCase")
]
We can also write a custom validator, but it’s beyond the scope of this article.
Finally, we’ll use Pandas to parse the JSON object into a DataFrame. Here is how we do it:
def to_dataframe(raw_data: str) -> pd.DataFrame:
    return pd.read_json(raw_data)
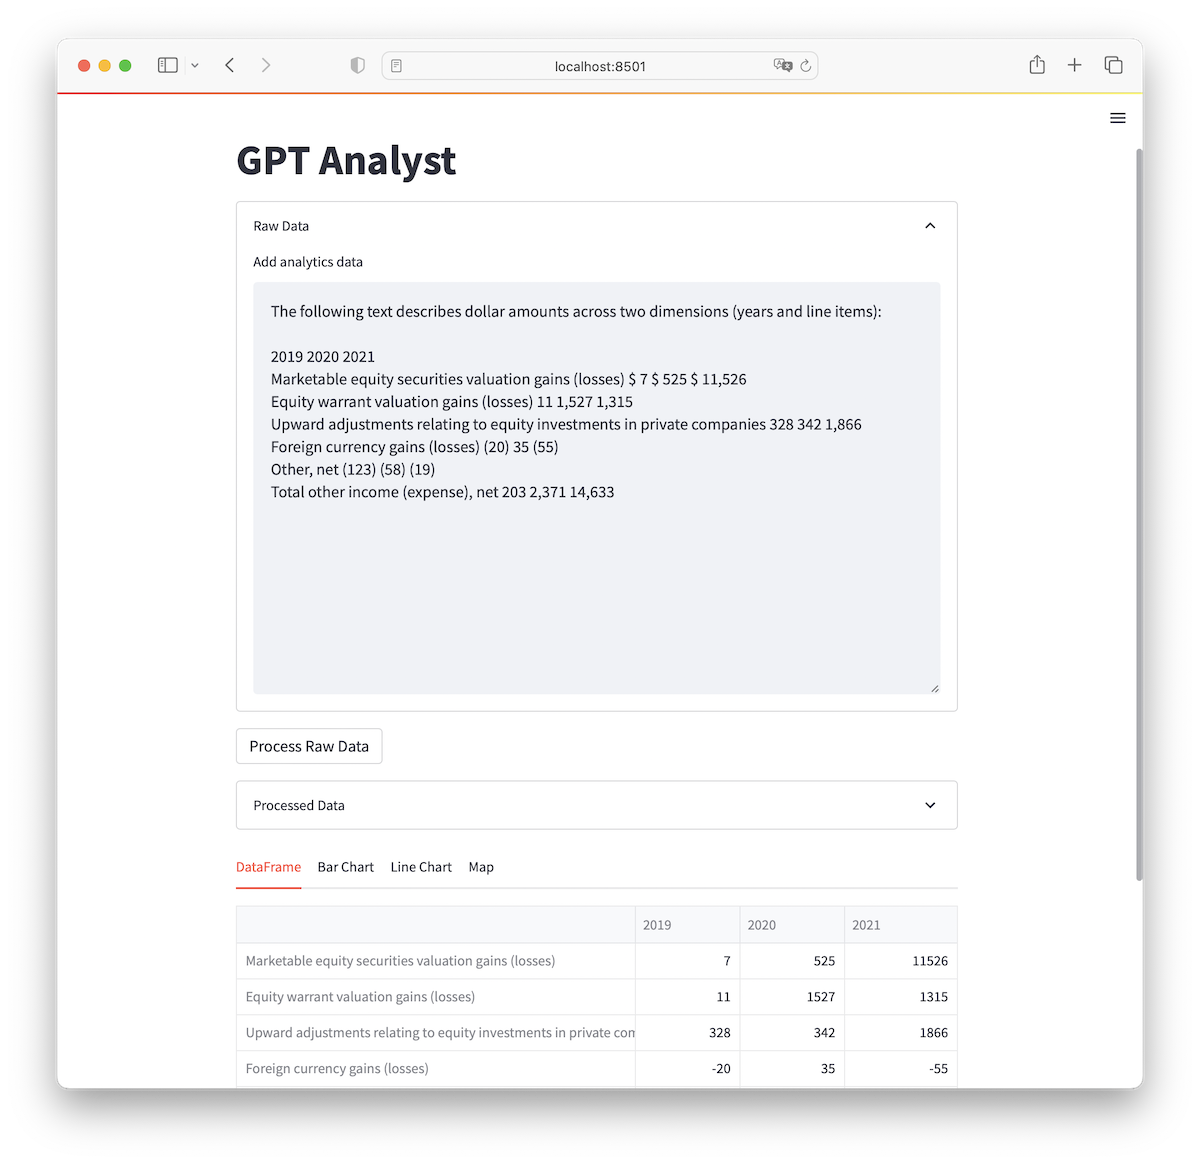
Finally, let’s see how the app does with different inputs! I copied some random text from an Amazon Annual Report PDF table and pasted it in the text form. Without proper formatting, the text looks somewhat ambiguous, so I gave it a little hint at the beginning and the model did a great job parsing everything correctly, even swapping out parenthesized values for negative integers:
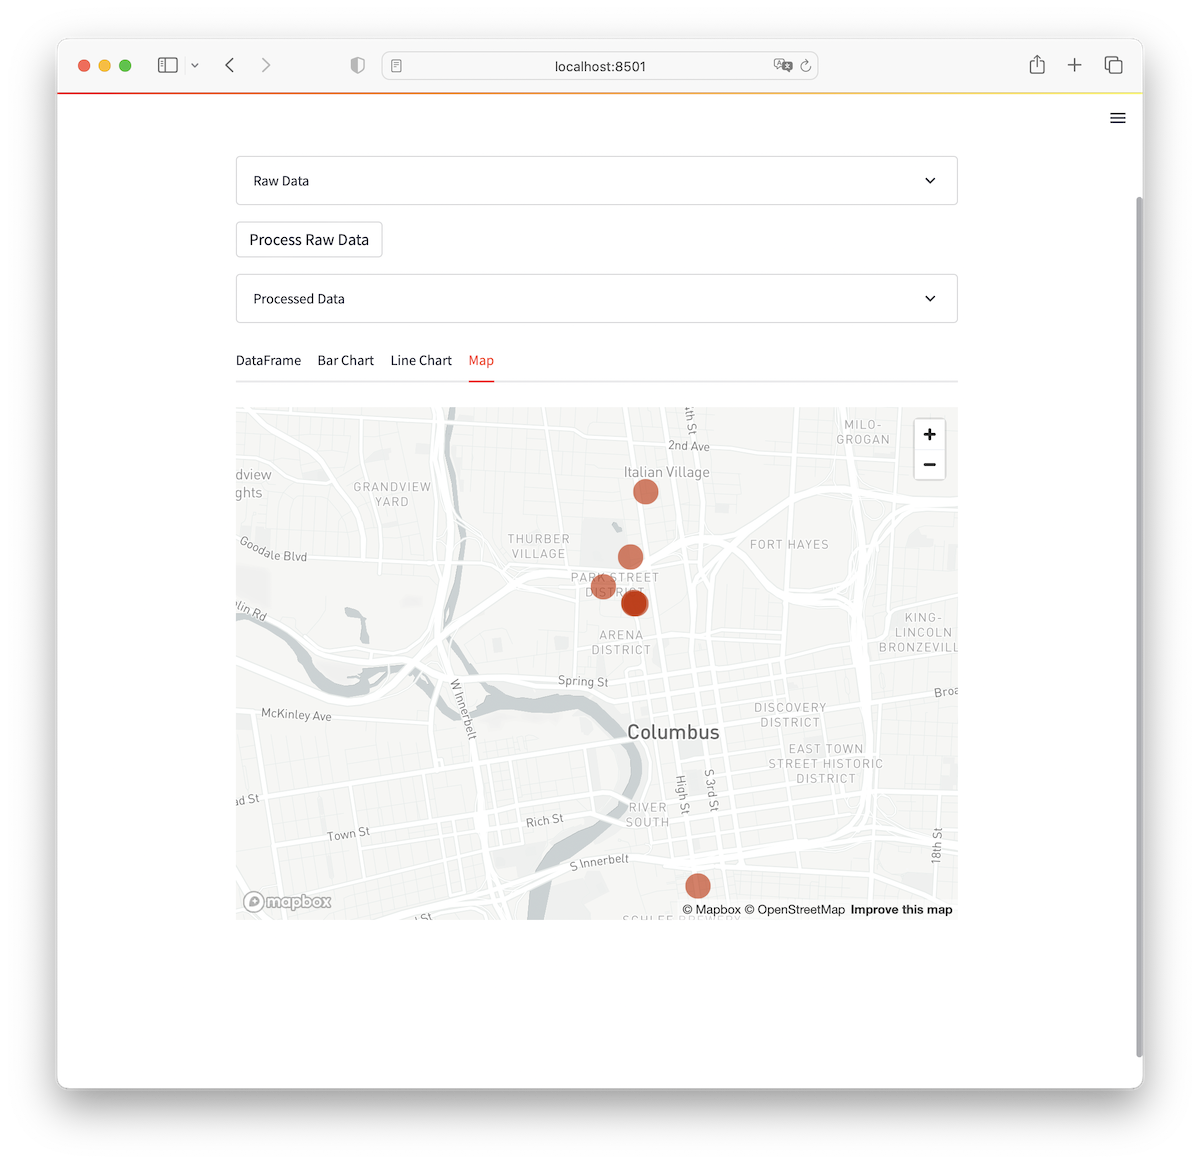
Now, let’s try testing our app with some geospatial data from a parking meters inventory dataset. I copy-pasted a few rows from the table and the language model interpreted them correctly and Streamlit rendered a pretty map:
GPT Analyst looks like a pretty simple app with lots of limitations (e.g., input and output sizes are restrictive, sometimes the model generates weird JSON, etc.) but just imagine what it means for developers in the future. It’s fun to think about how this simple example can be extended—ideally, analysts would want to load full annual reports into the app to get summaries with charts and tables. While there are definitely some hurdles before it can be done cheaply and quickly, it’s not as crazy as it sounds.
That’s a wrap!